Fall 2022 Mid-Term Exam Solution on Regression Analysis- SPSS from the University of Cambridge
Exam Question: explain the linear and multiple regression analysis
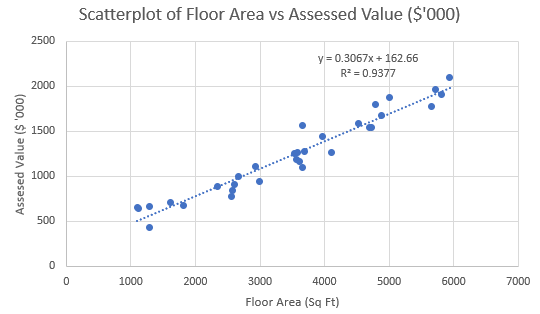
The scatterplot shows a linear relationship between floor area and the property's assessed value. The R-squared value of the regression model is 0.9377, which suggests a strong linear relationship between the two variables.
The following figure shows the linear regression output between floor area and property assessment value.
Figure 2: Regression output of Assessment value and floor area.
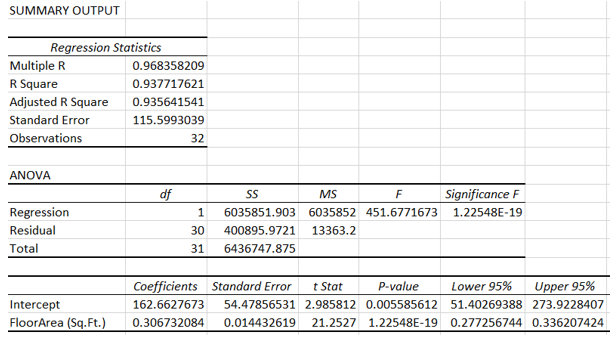
The F-statistic is equal to 451.68, and the p-value is 1.225*10-19 < 0.05. Thus, the null hypothesis is rejected, and the linear regression is statistically significant. Thus, floor
The following scatter plot shows the relationship between the age of a building and the assessed value.
Figure 3: Scatterplot of the age of the building and assessed value.
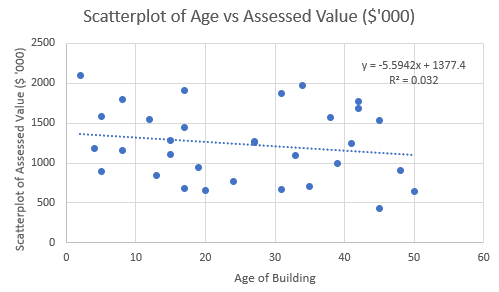
The scatterplot provides very little evidence to support the hypothesis of a linear relationship between the two variables. The R2 value of 0.032 indicates little support for a linear relationship between the two variables.
Figure 4: Regression output of age of building and floor area.
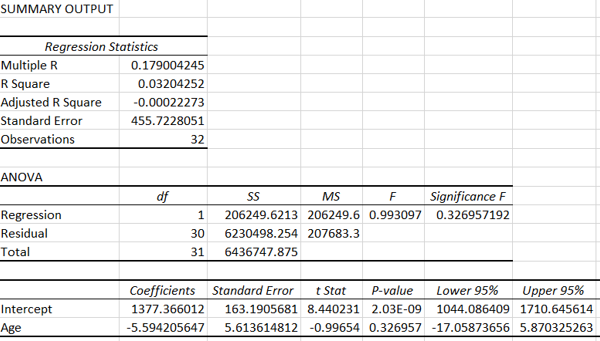
The p-value of the Age variable is 0.327 > 0.05. Thus, one fails to reject the null hypothesis, and it concludes that age is not a statistically significant predictor of assessed value.
The following figure shows the output of the multiple regression analysis
Figure 5: Output of multiple regression model.
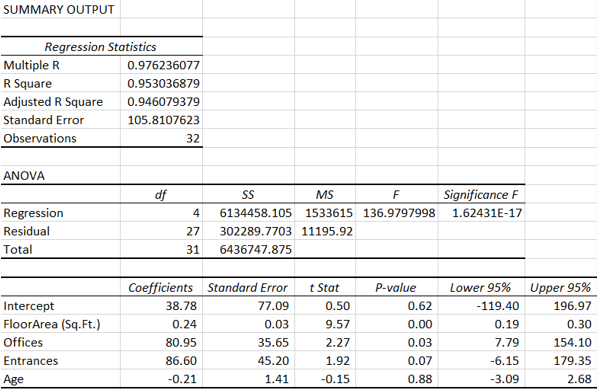
The overall r2 value of the model is 0.953, while the adjusted r2 value is 0.946. At a significance level of 0.05, floor area and the number of offices are statistically significant, as their p-values are less than 0.05. The number of customer entrances and the age of the building can be eliminated.
The following figure shows the output of a multiple regression model, with only floor area and the number of offices as predictor variables.
Figure 6: Multiple regression outputs
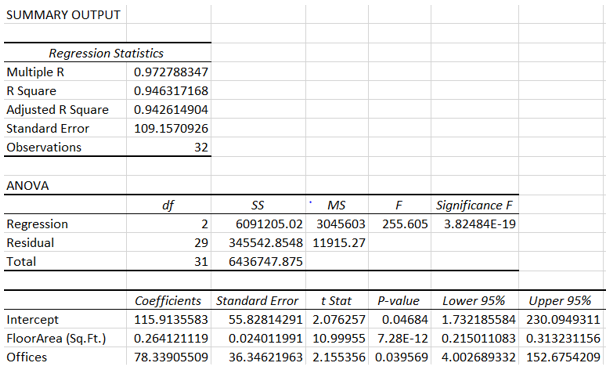
The final model is Assessed Value = 115.9 + 0.26*Floor Area + 78.34*Offices
The assessed value of a medical office building with a floor area of 3500 Sq.Ft. and 2 offices is $2,215,423.302. The predicted assessed value is not consistent with the database as the highest assessed value is $2.094 million, but the predicted value lies outside the range of the assessed values.