6 Questions to Gauge Your Understanding Of Exam Approach on Models Produced By Firms
Explain the History of the Models Produced By Firms
What Are The Terminologies Used In The Corporate Models?
| Variable | How is it calculated |
| A Sales (total revenue) | Forecast |
| B Manufacturing costs | A X estimated parameter |
| C Selling expense | A X control variable |
| D Research expense | A X control variable |
| E Other expense | A X estimated parameter(s) |
| F Total expense(TC) | B + C + D + E |
| G Depreciation | control variable |
| H Profit before tax | A - (F + G) |
| I Tax on income | H X forecast parameter |
| J Profit after tax | H - I |
State and Explain Some of the Corporate Models Used In The 1960s
Income Statement Heading |
Th flow of Funds Source |
Influences |
|---|---|---|
A Sales |
GNP x estimated parameter |
Sales expense |
B Labour cost |
A X estimated parameter |
|
C Materials |
A X estimated parameter |
|
| D Sales expense |
|
Control variable |
| E Research expense |
|
Control variable |
| F Interest expense |
|
Long-term debt |
| G Total Costs |
|
|
| B+C+D+E+F |
||
The Boise-Cascade model
This model was relatively unusual when it appeared because rather than being a simulation, it modelled the markets in which the company operated to decide on optimum strategies at any time.
In essence, the idea is very simple. The company is a vertically integrated firm in the timber industry in the western USA. It thus has the choice at any stage of production of:
- Buying in inputs
- Using its inputs (subject to stock/production)
- Selling to the market
- Selling to its next stage of production
- Not producing at this stage of production
These choices are summarized diagrammatically in Figure 9.1. We can see that at each of the four main stages in production, the firm has the choice of using the market as an alternative to its own. The method followed was to specify carefully
- The firm's objectives;
- The constraints at each stage of production; and
- The production function
In this particular case, it was possible, when this was done, to use a known technique, linear programming, to decide on the 'optimal' decisions for the firm, given particular market prices.
In many ways, the Boise-Cascade model was symptomatic of what firms would try to do. They would try to apply known optimizing techniques to particular problems. However, the main problem with doing this for a whole firm was the needed data. Thus we find many firms in the 1970s decided to tackle smaller problems where the data problems were not so acute.
State and Explain Some Corporate Models of the 1970s
What happened in the 1970s was probably the result of two factors, the growing experience and professionalism of managerial economists and developments in computing. The managerial economists, whether systems analysts, management accountants, management consultants, operations researchers, or academics, had learned to analyze situations more carefully before pro- posing the model that would solve the problem. This tended to produce better and, very often, less ambitious models. The development of computing, however, made the ambitious model more feasible and cheaper. Cheaper computer memory has made large amounts of data easier and cheaper. Time-sharing (see Appendix A) has made the testing of models easier and opened up computing to many more firms by hiring time from computer bureaux. Mini and microcomputers expanded the market to the point where any firm could afford some form of computing. Thus the possibility of every firm having models of some of its problem areas became a reality.
How these two factors, professionalism and cheaper computing, influenced the development pattern in the 1970s.
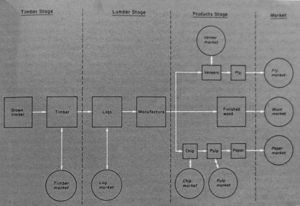
Fig. 9.1 Boise-Cascade model
Common features
One feature which persisted from the 1960s was the large model. There seem to have been two main reasons for this. One was the idea put about by many 'information scientists' that a firm should have an information system that consisted of a database that could be used for almost any purpose given the right programs. This was reinforced by the apparent success of this approach in the NASA space explorations, where a TV audience of millions saw the success of computer-based control and information systems. The second reason was that technology reduced the cost of using large databases. Thus one feature of the 1970s was the continued attempt to build 'the system', which would solve many of the firm's problems from the same data.
This approach foundered on three substantial rocks-feasibility, costs, and irrelevance. Many of the systems were not feasible because computers in the early 1970s could not stay up for many hours in every twenty-four hours that the 'system' needed to operate. If the system had a 'backup' built, it ran into the second cost problem. Reliability might mean doubling up on equipment and regularly copying masses of data. This was cost-effective if the result was beating the Russians to the moon, but not if the profit margin concerned was very small. The third objection to the big systems was their irrelevance to the needs of management. At the beginning of this book, we stated that models should be built for a particular purpose and that there was no one model of the firm or the economy which would solve all problems. This point is neatly illustrated by the level of aggregation at which information is presented. An area representative wants to know the sales per retail outlet. The regional sales manager will want to know sales per representative and the brand manager sales by social class and region. It is possible that one set of data could be coded and then manipulated to provide each user with their needs. Still, it implies either collecting information in great detail to form the initial database or having different databases for different managers, which tends to defeat the idea of 'the' information system.
However, the idea of an 'information system' persisted as a unified computer system in which all problems could be solved. However, this was made obsolete by the success of mini and microcomputers, which meant that particular problems could be put on small machines that could operate in a language that the users understood. Thus different managers could have their models on their computers.
What Are The Features Of The Corporate Models Of The 1970s?
The main feature of the 1970s; was building models to solve particular problems.
The great bulk of the modelling effort of the 1970s went into helping particular managers with particular problems.
One result of this provides another feature of the models: they tend to be a management aid rather than a management replacement. Thus there are very few optimizing models. Models that take decisions are replacing managers but may not be superior. Their contribution can be much greater if they are seen as a management aid.
This brings us to another feature - the volume of data and detailed calculation involved in many models, an area where the computer is very helpful. This is brought out in the example of the five-year plan discussed below.
The last feature also follows the previous features. Most models will be close simulations of existing systems and use characteristic terminology. They will use terms with which the relevant managers are conversant and produce output in customary form. Thus they will appear to be 'marketing' or 'accounting' models rather than 'economic or 'operations research models. This may be more a matter of appearance than reality, but it is essential if managers use models to aid decision-making.
State the Examples of the Corporate Models of The 1970s
We now look at five examples of models of the 1970s, taken from the account by Mann and Mulvaney (1976), which illustrate some of the features already outlined.
CPC Europe's 'facility planning system.'
This model is a computerized version of the previous planning system where investment in new production facilities should occur. The starting point is forecasts of future demand for products, and the object is to achieve the necessary increases in output at the lowest cost. It looks like a classic opportunity for a large 'optimizing' program, but the system chosen combines optimizing algorithms with the judgment of the planning staff. The staff chooses which constraints will be in operation in a particular situation. For instance, is the increase in demand in a country to be met by the plant or plants in that country, or should the other plants in Europe be considered? Within the constraints specified by the planner, the program calculates the cheapest way of producing the in- crease in demand for the products. As the firm produces a wide range of consumer products and about 500 bulk ingredients for about 60 other industries, the computer is ideally suited for this aspect of the operation. The planner can then change one of the constraints - for example, include another plant to supply some of the markets - and see what effect this has on the cost. Through including a large number of optimizing routines, such as taking account of spare capacity, calculating effects on other products and in production, and transport costs, the system frees the planner to do his job and look for the 'creative' solutions the machine cannot be programmed to generate.
Kappa: a wholesale pricing model Mann and Mulvaney (1976) describe a model produced for the wholesale pricing of a product called Kappa. The firm sold a large part of its output to nine supermarket chains and wanted to know what pricing policy to follow when making 'trade discounts' to these large customers. As these firms accounted for an in- creasing portion of the product demand (1972, 53%; 1973, 56%; and predicted to be 65% by 1980), it was important to know what effect the discounts had on sales. The problem was simplified by the available sales records, broken down by 'account' (company), size of order and price. Knowing the seasonal variations in demand and sales in months when special deals were not made, the effect of lower-than-usual prices could be estimated. They could then be plotted against the discount to give a curve like that in Figure 9.2.
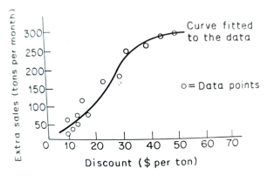
Figure 9.2. Effect of discounts on sales
Thus the firm could predict the effect of cutting prices to particular customers on its total sales. This simple example of a demand model is included to emphasize that many of the models of the 1970s were small and simple. They solved a particular problem rather than all the firm's problems!
Building Bits: a planning-structure model. This model provides the closest parallel to the planning-structure models of the 1960s. The company (called Building Bits by Mann and Mulvaney (1976)) provides materials to the construction industry in the UK. With the company's own staff, the consultants produced two models: financial evaluation and long-term planning. We look at the first, which has to consider- able affinities to the early models which were structured to culminate in the company's annual financial statement. In this case, the project involved improving and computerizing the cost-accounting system so that the effect of different decisions could be simulated. The model is very detailed and thus can be used for actual financial control and simulating decisions. Thus it exemplifies one possibility opened up by advances in computing, the detailed 'information system'. However, the particular model differs from classic information systems in that it is designed to solve particular decision-making problems rather than provide a wide variety of information. For example, the crucial output from the system is the forecast of plant operations for the next five quarters and the effect this will have on profits and cash flows. Figure 9.3 outlines the model.
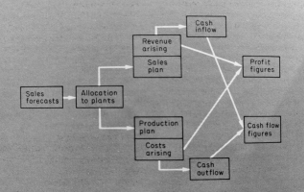
Fig. 9.3 Building Bits: outline of the model
Perhaps there are three main points to emphasize about this model. First, it provides a quick way of simulating possible decisions or evaluating the effect of changes (such as costs or taxation) on profits and cash flows. Second, it reproduces and fits in with the systems and terms already used in production and financial planning in the company. Finally, it is a simulation model which tells management the results of decisions rather than an optimizing model, which would tell management what decisions to make.
Alpha: demand prediction 'Alpha' is a confection (candy) introduced by a firm called 'Vincent' by Mann and Mulvaney (1976) to the UK in 1962. It sells mainly to children and teenagers. In 1964-69 the sales volume had grown by 360%, and the firm wanted to produce a model of the market which would enable it to plan production and sales efforts for up to ten years. The crucial problem was deciding the main reason why children bought the product. The eventual hypothesis relied on a detailed market survey done in 1968 and assumed that the main influence was habit and the recommendation of older children. This was plausible because there was relatively little TV advertising of the product or its immediate competitors. The model embodied this assumption, demographic (population) assumptions, market research data produced by the trade association, and a market research organization. The model was used every two months from 1969 to 1975 with only relatively minor changes.
Given the detailed work on this model and its testing, the firm could confidently plan production and sales efforts. Again we have a simple model which solves a particular problem, a model of a market rather than a model of the firm. However, our last model of the 1970s does model the firm as a whole.
The five-year plan
This model, called a 'five-year planning model' by Mann and Mulvaney (1976), does attempt to provide a means of planning the next five years for a division of a large chemical company.
For the parent group, the division had to prepare a detailed statement of its expected performance over the next five years. Normally this process took about fifteen weeks, with different managers playing a part from time to time. The management services section coordinated the process.
The model enabled the process to be carried out in six weeks and produced a common language in which accounting, production and marketing staff could discuss the division's future. This was achieved by examining the previous planning system, refining it where there were organizational problems, and transferring all the detailed calculations to computer programs. The managers make the decisions and decide which alternatives to investigate; the computer shows the result.
One of the interesting features of the model is the refusal to 'model' areas where there is no statistical evidence. For example, managers must make assumptions about what market share will result from a pricing strategy and what rival firms will do. Thus the 'five-year planning model' enables managers to do their job, make decisions and see that they are carried out.