Fall 2022 Mid-Term Biostatistics Test Solutions in SAS University of Delaware
Below are neat biostatistics test solutions written for a mid-term assessment done at the university of Delaware in spring 2022. The solutions were developed by our biostatistics test takers. In case you’re also stuck and seeking similar help with SAS Exam, we’re ready to offer it instantly. Simply get in touch with us and we’ll save your grades at an affordable rate.
Question 1: Greene and Touchstone conducted a study to relate birthweight and estriol level in pregnant women. Estriol data (given) is a sample data from Green-Touchstone study relating to birthweight and estriol level in pregnant women near term. In this data set, estriol is measured as mg/24 hr. and birthweight is measured as g/100.
Do the following calculation using the Statistical Analysis Software (SAS).
- The primary purpose of this study is to predict birthweight based on estriol. What is the dependent variable and what is the independent variable? Will the regression line be “regression of estriol on birthweight” or “regression of birthweight on estriol”?
- Write the equation of the regression line in the following format.
(Hint: example – Weight=β0+ β1 Height + ϵ ). What are β0, β1, and ϵ ? Why this regression is called simple linear regression?
birthweight=β_0+β_1 estriol+ϵ ,
β_0 is the intercept,〖 β〗_1 is the slope while ϵ is the error assumed
to be normally distributed with mean 0 and variance 1
The regression is called simple linear regression because the dependent variable is regressed on only one independent variable.
- What assumptions must be satisfied in order to validate the results of linear regression?
The assumptions to be satisfied are:
- Calculate the estimates of β0, β1 and interpret these values.
Estimates of β0, β1 and their interpretations
β0= 21.5234
β 1= 0.60819
β0 implies that the expected value of birthweight is 21.5234 when estriol is constant.
β1 implies that the expected value of birthweight increases by 0.60819 as result of unit increase in estriol.
- What is fitted simple linear regression model? Write in terms of estimated values from part (e). (Hint: For example- estimated weight=3.5+0.75*height)
estimated birthweight = 21.5234 + 0.60819 * estriol
What is the predicted value of birthweight when estriol is 10 mg/24 hr.?
predicted birthweight=21.5234 +0.60819*10
Hence, the predicted value of birthweight when estriol is 10 mg/24 hr is 27.6053
- What are values of the Total sum of squares, SS due to Regression, and SS due to Error. What are the degrees of freedoms of Regression and Error?
| Source | Sum of Squares | Degree of freedom |
| Regression | 250.57448 | 1 |
| Error | 423.42552 | 29 |
| Total | 674.00000 |
- Calculate the mean square of regression (estriol)(MSR), mean square error (MSE), and R2 manually using the values from part (i) and compare the output from SAS?
MSR = SSR/(dfR )
= (250.57448)/1 = 250.57448
MSR = SSE/(dfE )
= (423.42552)/29 = 14.60088
R2= (250.57448)/(674.00000)= 0.3718
- What is coefficient of determination? How do you interpret coefficient of determination in this problem?
Coefficient of determination is the percentage of variation in the dependent variable explained by the independent variable.
In this problem, R2=0.3718 implies that about 37.18% of the variation in birthweight is explained by the estriol.
- What are the residuals (errors) in regression analysis?
In regression analysis, residuals are the estimated errors for the model, it is the difference between the estimated dependent variable and the dependent variable. That is ϵ = y - y [Residual = Observed - Expected]
- Is CI wider or narrower than prediction interval? Why?
A prediction interval is always wider than the confidence interval.
Reason: Prediction interval account for an uncertainty in estimating population mean plus the random variation of the individual values.
- What is the predicted value of birthweight when estriol is 50 mf/24 hr.? How do you interpret this result?
predicted birthweight = 21.5234 + 0.60819*50
Hence, the predicted value of birthweight when estriol is 50 mg/24 hr is 51.9329
The expected value of birthweight for pregnant women with estriol of 50 mg/24 hr is 51.9329
QUESTION 2: Use the previous output to do the followings.
- Analyze the estimates and check if they’re significant? Are they? Please explain.
The estimates are significant. This could be seen in the table below as highlighted. the p values for both the intercept (0.0001) and the slope (0.0003) are less than the significance level. (0.05)
| Parameter Estimates | |||||
|---|---|---|---|---|---|
| Variable | DF | Parameter Estimate | Standar Error | t Value | Pr > |t| |
| Intercept | 1 | 21.52343 | 2.62042 | 8.21 | <.0001 |
| Estriol | 1 | 0.60819 | 0.14681 | 4.14 | 0.0003 |
- Is this model good model for the given data? Check ANOVA output and explain.
Yes, the model is good and adequate for the given data.
| Analysis of Variance | |||||
|---|---|---|---|---|---|
| Source | DF | Sum of Squares | Mean Square | F Value | Pr > F |
| Model | 1 | 250.57448 | 250.57448 | 17.16 | 0.0003 |
| Error | 29 | 423.42552 | 14.60088 | ||
| Corrected Total | 30 | 674.00000 | |||
Since the p-value is less than the significance level (5%), we reject the null hypothesis and conclude that the model is well fitted to the given data.
- Are all the assumptions valid? Provide detail based on the model diagnostic plots
Diagnostic plots
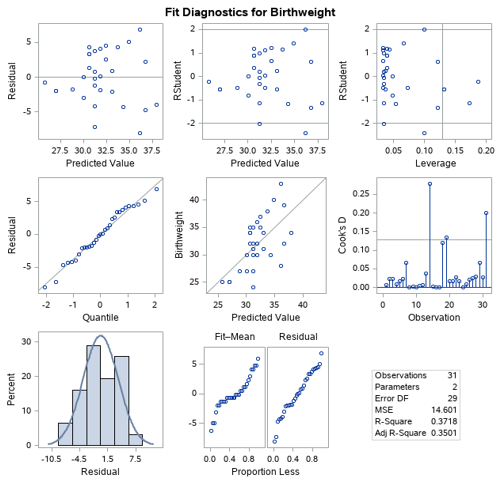
- Is there a linear relationship between means of Y and X values?
From the scatter plot, there exists a linear relationship between means of Y and X values
- Does the error have a constant variance? Which plot shows that there is constant variance? What would have happened if the variance were not constant?
The errors have constant variances. This is revealed by plotting Residuals against the predicted values.
- Are Y values independent? (This can’t be seen from plots, use some assumption)
Y values are independent since the residuals have a random pattern
- Are residuals normal?
The residuals are normal because the histogram is bell-curved shaped
- Are there any possible outliers in the data? How do you see them from diagnostic plots, explain?
There are possible outliers in the given data. This could be seen by the cook’s distance in the diagnostic plots.
- What does Fit-mean Residual (Residual Fit Spread) plot indicate? How does this compare with R2?
Fit-mean Residual (Residual Fit Spread) plot is to address issue of Linearity, Outliers and Homoscedasticity (equality of variance).
- What is your overall conclusion of this analysis?
Since the individual parameter estimates as well as the overall model are significant, we conclude that the model is adequate and significant as the basic assumptions are also met, hence, the model can be used to make prediction or projection of birthweight given a particular estriol.
| Number of Observations Read | 31 |
| Number of Observations Used | 31 |
| Root MSE | 3.82111 | R-Square | 0.3718 |
| Dependent Mean | 32.00000 | Adj R-Sq | 0.3501 |
| Coeff Var | 11.94097 |